role
Timeline
Timeline
Context

———— The bet
Broadway, a high-end mall in Hyderabad, was hosting Deep Holistics' wellness kiosk: a quick scan of a shopper's skin,hair and body. The bet was simple.
Would people pay for recommendations built around their unique heath data, not generic categories like "oily skin"? And could that pull them toward the flagship full-body analysis?
The scan could produce the data. The problem was everything that came after. The machine generated a 20-plus page clinical report packed with graphs, scientific terms and unexplained metrics. It was technically correct, but almost impossible for a customer to interpret.
And this wasn't a concept to polish over weeks. It had to go live in a working store over one weekend. A dashboard was out of scope. We had roughly 1.5 days.
problem 01
Make the data understandable.
A person standing in a store should grasp their result in minutes, not decode a clinical printout.
problem 02
Make it produceable, fast.
Fast enough that a live store with a queue could actually keep printing reports.
———— frame 01 decode
I came on expecting to design a report. Very quickly I realized that wasn't the first problem. Even our own design team couldn't confidently interpret the machine output.
The face scan had eight panels with no explanation. The hair analysis had fields like "single follicle proportion" and "follicle double root ratio." Body composition reported metrics like SMM; some graphs had no axis at all. Designing around outputs I didn't understand would have meant guessing.
So I stopped designing and decoded the source first.
I worked through a vendor walkthrough, cross-checked it against videos of the same scans, and mapped the machine's opaque terminology onto customer-relevant concerns. With the doctors, I decided which metrics actually mattered to a person receiving the report, rather than a specialist reading raw output.
This wasn't a new research project. An earlier product had already shown the pattern that mattered: people get overwhelmed when clinical data arrives without context or everyday meaning. That insight transferred directly.
With only 1.5 days, repeating that research wouldn't have changed the design decision. The scarce time was better spent understanding the actual black box.
———— frame 02 REdesign
The raw report handed a customer a verdict and left them alone with it.
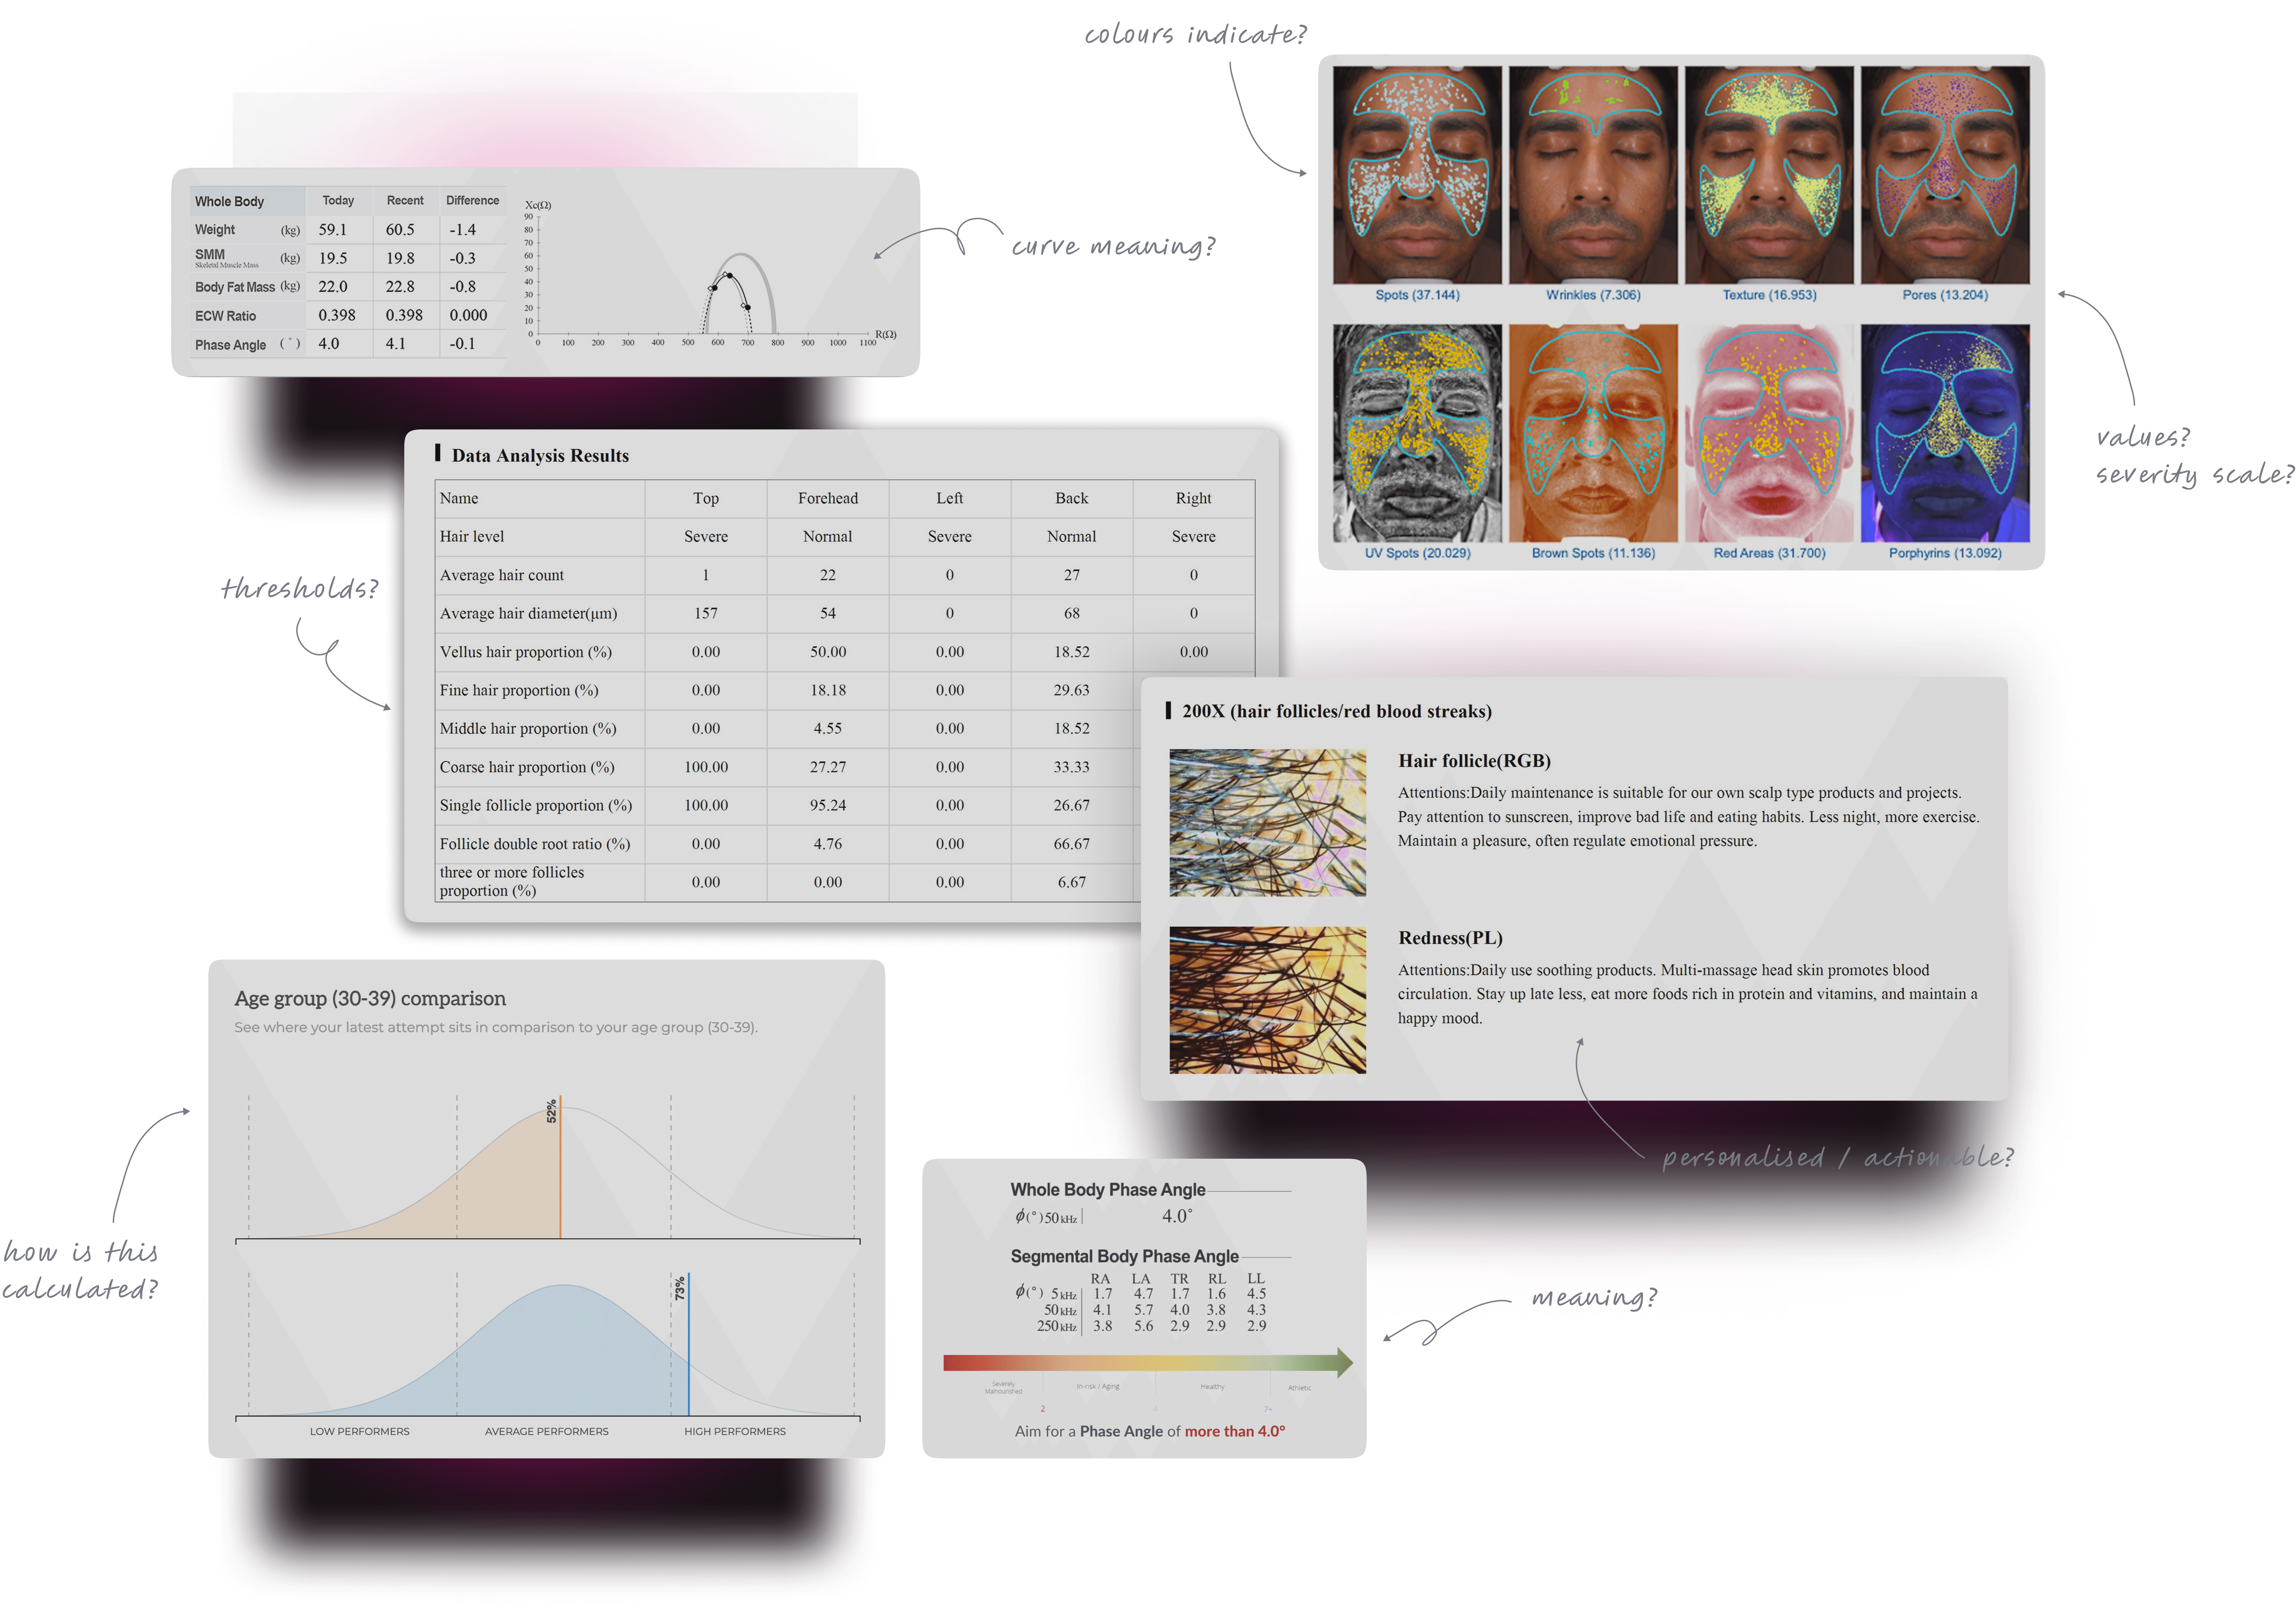
But the customer still had to work out: what does this measure? where does it apply? should I worry? what do I do about it? The report wasn't failing because the science was wrong. It was written for a machine, not a person trying to understand their body.
— principle
Every finding became a small, self-contained explanation, the same five moves every time. The result itself wasn't softened. "Poor" stayed "Poor." What changed was the framing around it. Instead of giving someone a number that might trigger anxiety, the report gave that number context and a constructive next step.


The goal wasn't to hide an uncomfortable result. It was to make the result understandable enough to act on.
— directions before converging
That consistency mattered beyond aesthetics. Every report used the same mental model, a stable way to read results and compare them over time. The report grew past 20 pages, but each page asked the customer to hold less in their head.
———— frame 03 personalise
A rules sheet could map a scan result to a product. But a scan alone couldn't know whether that product actually suited the person. So the system started with a machine suggestion, and a wellness expert adjusted it in conversation, based on the customer's routine, suitability and circumstances. That final call was written back into the report.
The experience wasn't selling a category. It was trying to make a recommendation fit a person, and the report was the persistent source of truth.
———— frame 04 systemize
The first reports were built manually. Each one took around 15 minutes. That might work for a few customers. It would not work in a live store with hundreds of people waiting. A dashboard was the obvious long-term solution, but building one before the pilot had proven demand didn't make sense. We didn't have the developer or testing time, and the vendor only provided rendered PDFs, not the underlying raw data.
So the PDF had to stay. The question became: could we make the PDF behave more like a system? After building several reports manually, I noticed something important.
Every scan image landed in the same position in every report. That repetition changed how I looked at the layout.
If a position never changes, it isn't just layout anymore. It's an anchor.
I standardized those anchors. For every image I defined an X/Y position, a width and height, and a semantic frame name. The engineer built a plugin that read the frame name, matched the extracted scan image to its fixed coordinate, and dropped it into place.

My role was to define the visual system, the coordinate map and the naming structure. The engineer built the plugin.
The design system created the structure the automation could operate on.
— Result
The 2–3 minute figure covers the report end-to-end: image placement and data population, not just one part of the process. Image extraction and placement itself took approximately 4–5 seconds once automated. The first automation test failed on Friday night when the machines finally arrived. We patched the plugin on the spot and retested. The system was ready for launch.
———— frame 05 Launch
The launch weekend was real demand, not a controlled design exercise.
friday evening
Machines were still arriving. The first automation test failed. We patched the plugin and retested.
saturday
Demand was strong. Report waits sat around five minutes. The scan cost ₹1,500 for three scans.
Saturday → Sunday
Demand kept climbing. The team raised the price ₹1,500 → ₹1,800 to slow it down. People kept buying at the higher price.
sunday
The system couldn't keep up. Waits stretched beyond an hour, and some reports weren't delivered until the next day.
The bottleneck had moved. The report itself was no longer the primary problem. The production system was.
An honest qualification: 2–3 minutes was the per-report production time after automation. It was not yet true end-to-end scan-to-report time at launch scale.
— PDF launched
— measured what the pilot proved
Over the 3-4 March launch weekend:
These figures are blended from payment records and on-ground counts: strong but estimated, not audited. Revenue lift and conversion into the flagship full-body analysis weren't tracked, so I don't claim them.
———— frame 06 phase 3
The pilot answered enough of the business question to justify investing further. The team later shipped a web dashboard.
No manual PDF handling. No WhatsApp sending. Scan-to-report finally came down to under ten minutes end-to-end. Earlier PDF customers were migrated, and the kiosk kept running.
The lesson wasn't that the dashboard was better. It was that we didn't need to build the dashboard first.
The lightweight report + automation system let the team validate demand before committing to a larger product. The pilot wasn't the final system. It was the fastest system we could responsibly use to learn.
———— 06 What i learned
The visible product was a report. But the leverage wasn't only in the screens. It came from understanding the source data, deciding what a customer actually needed to see, standardizing the experience, and then making that structure usable by an automated system.
interface
made the data understandable.
system
made the interface scalable.
———— next what i'd build next
The report currently ends with a list of recommended products. Useful, but it doesn't fully answer "what do I actually do next?" The next version I'd build turns the recommendation into a routine:
Daily
2x / week
AM/PM
The goal isn't more products to remember. It's a plan someone can follow.
product imagery
Let customers recognize a recommended product instantly on the Broadway shelf.
Cart + home delivery
Close the loop from recommendation to purchase without leaving the report.
live stock availability
Show whether a recommended product is actually in stock at Broadway before the trip.
These were deliberately left out of the MVP: Broadway had no product-image repository, fulfillment capability or stock API to support them.